
Introduction
No single memory technology is at once fast, large and cheap. Static RAM is fast but costly per bit, DRAM is slower but dense, and magnetic disks and flash are slower again but cheaper still. A memory hierarchy stacks these technologies so that a small, fast level sits close to the processor and holds the data in current use, while larger, slower levels hold everything else. If most accesses are served by the fast level, the whole system behaves almost as fast as the top level and almost as large and cheap as the bottom one.
The hierarchy works because programs show locality of reference. This note defines the performance measures (hit ratio, miss penalty, average memory access time), derives the two access models GATE uses (hierarchical and simultaneous), extends them to several levels, and shows how memory stalls enter CPI. How a cache is organised is the subject of Cache Memory and Cache Mapping.
Prerequisites
- None within the notes. The note uses only averages and percentages; interleaving, which reduces the miss penalty, is explained in the memory interfacing note listed under Related topics.
Core concepts
Levels and locality
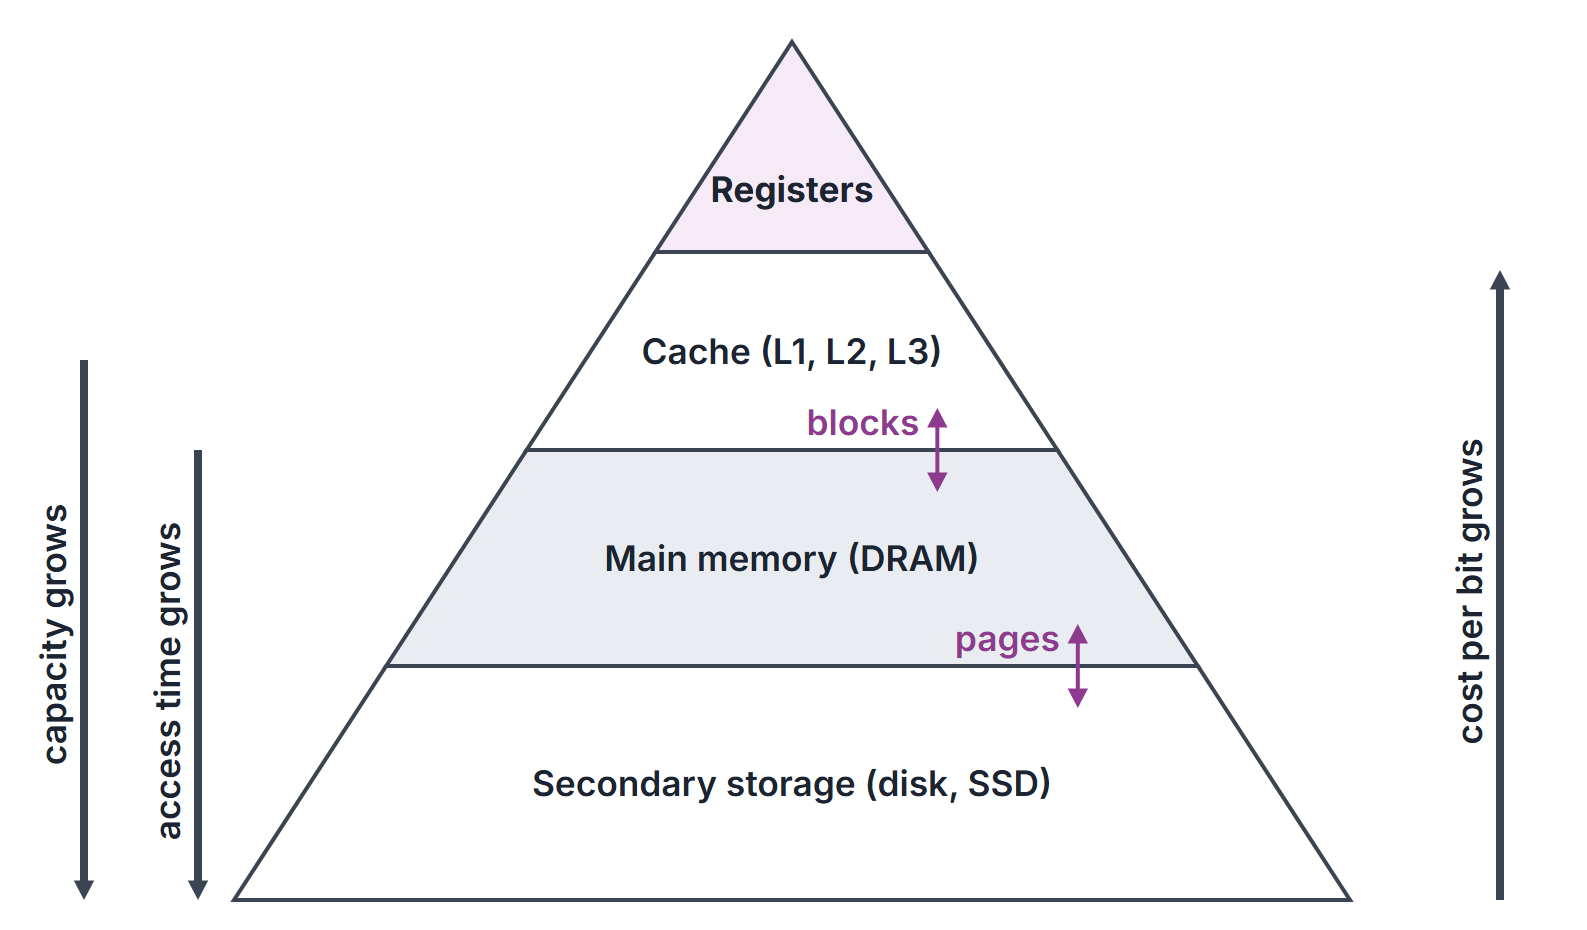
| Level (top to bottom) | Typical technology | Managed by |
|---|---|---|
| Registers | Flip-flops inside the processor | Compiler |
| Cache (L1, L2, L3) | SRAM | Hardware |
| Main memory | DRAM | Operating system (with hardware for address translation) |
| Secondary storage | Magnetic disk or flash (SSD) | Operating system |
Going down: capacity grows, access time grows, cost per bit falls. Data move between adjacent levels in fixed units: blocks (lines) between cache and main memory, pages between main memory and disk.
- Temporal locality: an item referenced now is likely to be referenced again soon (loop variables, instructions of a loop body). It justifies keeping recently used data in the fast level.
- Spatial locality: items near a referenced item are likely to be referenced soon (sequential instructions, array elements). It justifies moving a whole block, not one word.
Inclusion. In many designs every block held in a level is also held in the level below it. This is a design choice, not a law; exclusive caches exist. Unless a question says otherwise, assume the lowest level named always holds the data.
Performance measures
| Term | Meaning |
|---|---|
| Hit | The requested word is found in the level searched |
| Hit ratio | Fraction of accesses that hit |
| Miss ratio | |
| Hit time | Time to access the level on a hit |
| Miss penalty | Extra time to get the word from the level below (often to fetch the whole block) |
| Average memory access time (AMAT, effective access time) | Expected time per access over hits and misses |
| Local miss rate of level | Misses at level divided by accesses that reach level |
| Global miss rate of level | Misses at level divided by all accesses made by the processor |
Different count: local versus global miss rate. With L1 local miss rate and L2 local miss rate , the global L2 miss rate is . Given one, compute the other.
How it works
On every access the processor looks in the top level first. Two organisations decide what happens on a miss.
- Hierarchical (look-through, serial) access. The next level is started only after the miss is detected. A miss costs the cache's time plus the memory's time.
- Simultaneous (look-aside, parallel) access. Both levels start together; on a hit the slower access is abandoned. A miss costs only the memory's time.
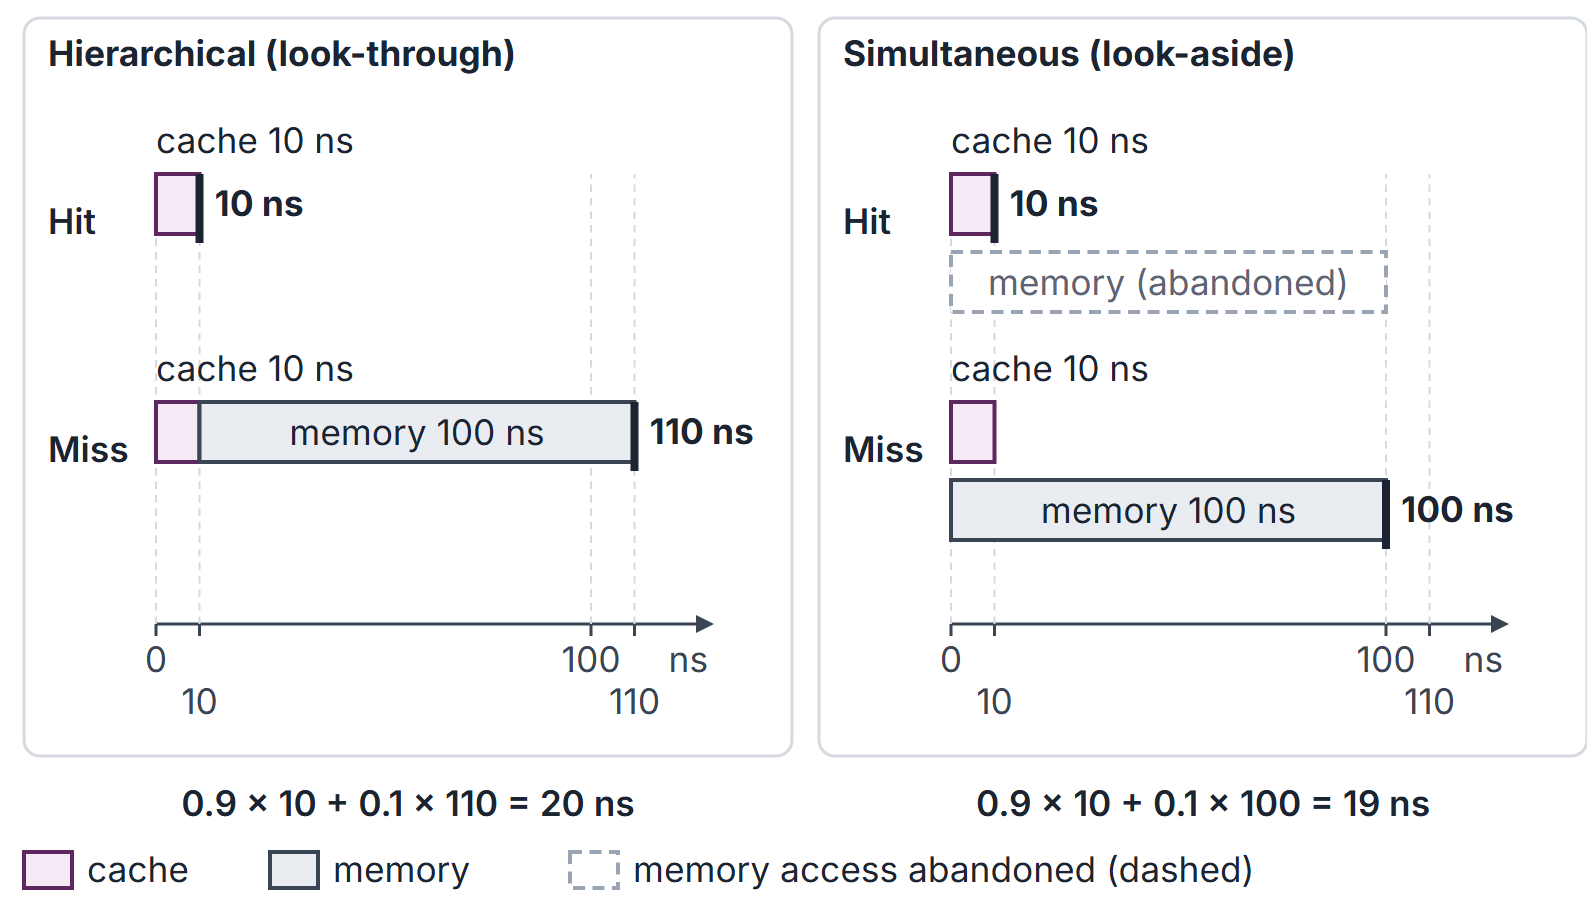
Figure 2 summarises the trade-off along the levels.
Algorithms and pseudocode
ACCESS(address)                       // two-level, hierarchical
  if address is in cache then
    return data after t_c             // hit
  else
    fetch the block from memory       // detected after t_c
    place it in the cache (may evict a block)
    return data after t_c + t_m       // miss
For simultaneous access the miss returns after , because the memory access began at time 0. Many questions model the miss penalty as "one memory access time"; others charge the time to transfer the whole block. Read which one is meant.
Mathematical explanation
Let be the cache access time, the main-memory access time (or the miss penalty when the question gives a block transfer time), and the hit ratio.
Hierarchical access.
Simultaneous access.
The two differ by , which is small when is high.
Three levels, hierarchical. With L1 time and local miss rate , L2 time and local miss rate , and memory time :
Three levels, simultaneous. Each access is served by the first level that holds the word, at that level's time:
Memory stalls in CPI. For a processor with base CPI (all hits), instruction fetches and data accesses per instruction, miss rates and , and a miss penalty of cycles:
Usually . The speedup of a perfect cache over this one is .
Block miss penalty. If a block of words is fetched from a memory that needs cycles to send the address, cycles per access and cycles to transfer a word:
| Memory organisation | Miss penalty (cycles) |
|---|---|
| One word wide | |
| words wide | |
| interleaved one-word banks |
Average cost per bit. Two levels of sizes and costs per bit cost on average per bit, close to when .
Disk access time (secondary storage level). Access time seek time rotational latency transfer time controller overhead. The average rotational latency is half a revolution: at revolutions per minute it is seconds. Transfer time is bytes divided by transfer rate.
Worked examples
Example 1: hierarchical versus simultaneous
Cache access 10 ns, main memory 100 ns, hit ratio 0.9.
- Hierarchical: ns.
- Simultaneous: ns.
- Without a cache every access takes 100 ns, so the cache gives a speedup of (hierarchical).
Example 2: the hit ratio needed for a target
With the same times, what hit ratio gives an average of 15 ns under hierarchical access? gives , so . Under simultaneous access, gives .
Example 3: two cache levels
L1: 1 ns, local miss rate 10%. L2: 10 ns, local miss rate 20%. Main memory: 100 ns.
- Hierarchical: ns.
- Global L2 miss rate: , that is 2% of all accesses go to memory.
- Simultaneous: ns.
- Without L2 (L1 then memory, hierarchical): ns, so L2 cuts the average from 11 ns to 4 ns.
Example 4: CPI with cache misses
Base CPI 1.0, one instruction fetch and 0.3 data accesses per instruction, instruction-cache miss rate 2%, data-cache miss rate 5%, miss penalty 100 cycles.
- Instruction-miss stalls: cycles per instruction.
- Data-miss stalls: cycles per instruction.
- CPI . A perfect cache would make the processor times faster.
- Halving the miss penalty to 50 cycles gives CPI .
Example 5: block miss penalty
A block has 4 words. Sending the address takes 1 cycle, each DRAM access 15 cycles, each word transfer 1 cycle.
- One-word-wide memory: cycles.
- Four-word-wide memory and bus: cycles.
- Four interleaved banks, one-word bus: cycles.
Interleaving gets most of the benefit of a wide memory with a narrow bus (see Memory Interfacing and Organization).
Example 6: disk access
A disk spins at 7200 rpm, the average seek time is 4 ms and the transfer rate is bytes per second. Read one 4096-byte block.
- One revolution: s ms, so the average rotational latency is ms.
- Transfer: s ms.
- Average access time: ms, millions of times slower than a cache hit. This gap is why a page fault is so expensive.
Important properties and observations
- Hierarchical access always costs the cache time. On a miss the total is , not .
- Simultaneous access cannot be slower than hierarchical access with the same parts; the difference is .
- Small miss rates matter. With a 100 ns memory and a 10 ns cache, going from 90% to 95% hits cuts the hierarchical average from 20 ns to 15 ns.
- Miss penalty, miss rate and hit time trade off. Larger blocks can lower compulsory misses through spatial locality but raise the miss penalty and, at fixed cache capacity, can increase capacity or conflict misses; a larger cache lowers the miss rate but may raise the hit time.
- Multi-level formulas use local miss rates inside the nested expression; the global rate of the last level is the product of the local rates.
- Memory stalls dominate CPI when the miss penalty is large: in Example 4 the stalls are 3.5 of the 4.5 cycles.
- Common misconceptions.
- "AMAT always." That is the simultaneous model; hierarchical access adds .
- "The L2 miss rate given is out of all accesses." Usually it is the local rate; check the wording.
- "Rotational latency is one full revolution." The average is half a revolution.
GATE examination perspective
- ACCESS MODEL. Identify hierarchical (the default when the question says the lower level is accessed after a miss) or simultaneous (when it says the levels are accessed in parallel).
- WHAT A MISS COSTS. One memory word, or a whole block transfer, or a block transfer plus the cache read: use the question's definition.
- LOCAL OR GLOBAL. Convert miss rates before substituting into the nested formula.
- READS AND WRITES. Write policies change the time of a write (see Cache Memory); combine read and write times with their fractions.
- CPI WITH MISSES. There is normally one instruction fetch per instruction; weight its penalty by the instruction-cache miss rate. Weight data accesses by the load/store frequency and data-cache miss rate.
- INVERSE QUESTIONS. Solve for the hit ratio or the memory time that achieves a target average.
- DISK TIME. Seek plus half a rotation plus transfer, with consistent units.
Summary
Sources
- C. Hamacher, Z. Vranesic, S. Zaky, Computer Organization, 5th ed., McGraw-Hill, 2002: Chapter 5, Sections 5.4 (Speed, Size, and Cost), 5.6.1 (Interleaving), 5.6.2 (Hit Rate and Miss Penalty) and 5.9.1 (Magnetic Hard Disks).
- D. A. Patterson, J. L. Hennessy, Computer Organization and Design: The Hardware/Software Interface, 5th ed. (MIPS edition), Morgan Kaufmann, 2013: Sections 5.1 (Introduction) and 5.4 (Measuring and Improving Cache Performance).
- W. Stallings, Computer Organization and Architecture, 10th ed., Pearson: Section 4.1 (Computer Memory System Overview), Appendix 4A (Performance Characteristics of Two-Level Memories) and Section 6.1 (Magnetic Disk).